Difference between revisions of "HGene"
Jump to navigation
Jump to search
Mark Wassell (talk | contribs) |
Mark Wassell (talk | contribs) |
||
| Line 29: | Line 29: | ||
* FGL - For internal representation of data. [http://www.haskell.org/ghc/docs/latest/html/libraries/base/Data-Graph.html] |
* FGL - For internal representation of data. [http://www.haskell.org/ghc/docs/latest/html/libraries/base/Data-Graph.html] |
||
* HaXML - For reading and writing SVG files and importing GEDXML files. [http://www.haskell.org/HaXml/] |
* HaXML - For reading and writing SVG files and importing GEDXML files. [http://www.haskell.org/HaXml/] |
||
| − | * |
+ | * HSQL - For access to back end data base. [http://htoolkit.sourceforge.net/] |
Revision as of 20:10, 16 December 2006
HGene - Geneological Authoring Tool
Vision
Acknowledging...
- Geneological information forms a graph.
- Charts need to be intelligent. For example, selecting a box showing a person, the user can view details for the person and add these details to the chart.
- Charts are not just one shot. Once a chart is generated, users will want to add (and remove) people from the chart. For example, select a person and right mouse click to add the children or the parents of the person to the chart if they are not already present.
- A person can appear in more than one chart. Charts can be tailored to show a particular fragment of the overall graph.
- User wants to group people and charts to form chapters and these into books and to output these to HTML or PDF.
Features
- RDBMS to store data.
- Internally, information is stored as an FGL graph.
- Use of GraphViz to generate chart layout to PNG or SVG.
- Chart editor that can read GraphViz SVG output and save out.
- Tool to import GedXML files into database.
- Basic query and navigation features.
- Capability to arrange people and charts into books with the ultimate aim of generating a book as a set of HTML pages or PDF.
- Sample database based on geneology of families involved in English Wars of the Roses[1]. This is a good example showing that geneology information does indeed form a graph.
Note: There is no update facility provided as yet and no immediate plans to. In theory geneological data is 'write once' data.
Libraries used
- Gtk2Hs - Provides GUI front end. [2]
- FGL - For internal representation of data. [3]
- HaXML - For reading and writing SVG files and importing GEDXML files. [4]
- HSQL - For access to back end data base. [5]
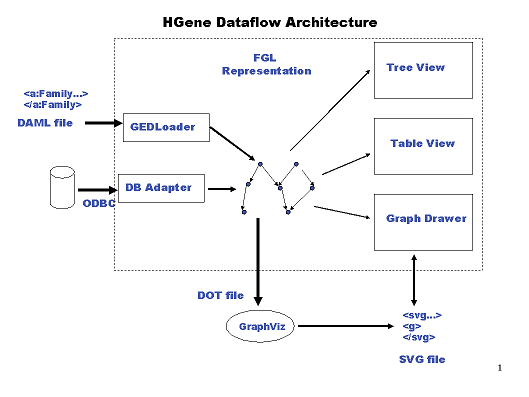
Architecture
Description of the components shown in the above diagram
- External Components
- Internal Components
- GedLoader - GEDCOM file which is in DAML format.
- HaskellDB/ODBC - Connector to database.
- Table View - View person records.
- Properties - View details for selected person.
- Tree View - View tree representation of books and chapters.
- Chart Viewer - View PNG output from GraphViz.
- Chart Builder - Control generation of chart using GraphViz.
- Chart Drawer - Read GraphViz SVG files and output 'in the same style'. These files do contain information about the underlying dabase record. Allow user to control colours, text font and line width. Undo/Redo stack. Lines snap to nodes and dragging node will drag lines as well.
Notes
A background need is to ensure that all of the above is generic and that any other structured data that is graph-like could be 'plugged' in (an immediate example is the data flow diagram above). An example of a 'book' with person details and charts is at [11]. This was generated using PHP. The above application is one that utilises some of the aspects covered in the wiki article Enterprise_Haskell
