Hackage statistics
Jump to navigation
Jump to search
The printable version is no longer supported and may have rendering errors. Please update your browser bookmarks and please use the default browser print function instead.
A sparkline depicting statistics about the Haskell library repository, http://hackage.haskell.org.
Updates per month since 2007

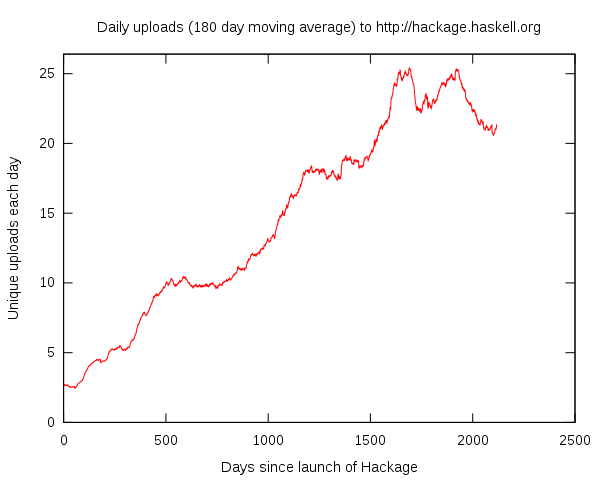
Releases of Haskell libraries and tools per day, on hackage, since inception
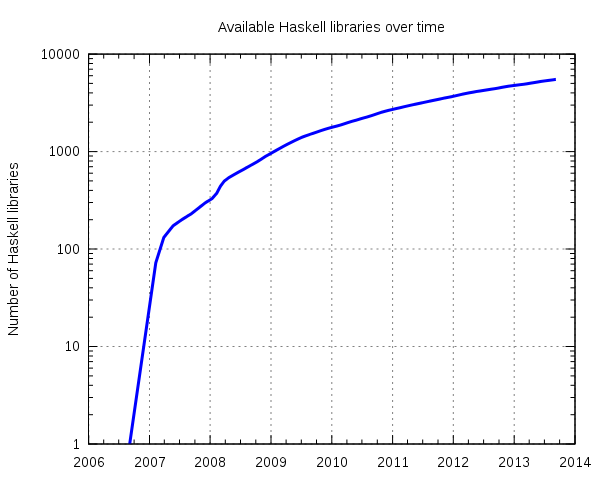
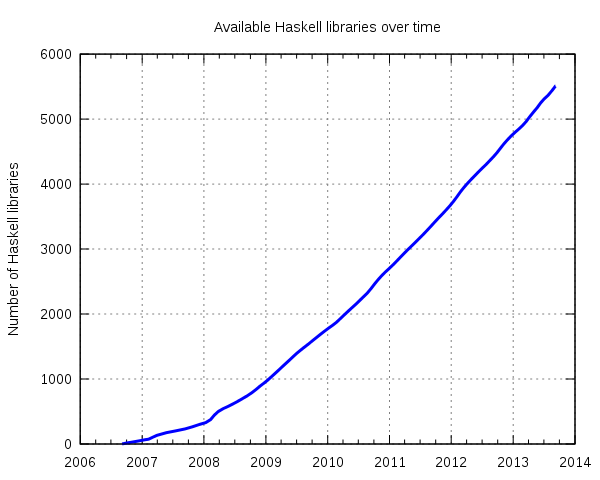
Available Haskell packages over time
(Via the Haskell gnuplot bindings).
Statistics
http://hackage.haskell.org/cgi-bin/hackage-scripts/stats
Graphics generated by the hsparklines library, by way of hackage-sparks.


