Difference between revisions of "ThreadScope Tour/Profile"
Jump to navigation
Jump to search
(paste from pandoc) |
(nicer stuff around images) |
||
| Line 3: | Line 3: | ||
Examine a ThreadScope profile on a realistic program |
Examine a ThreadScope profile on a realistic program |
||
| − | [[Image:ThreadScope-sudoku2.png| |
+ | [[Image:ThreadScope-sudoku2.png|600px|Threadscope on Sudoku2]] |
== Concepts == |
== Concepts == |
||
| Line 18: | Line 18: | ||
threadscope sudoku2.eventlog</pre></li> |
threadscope sudoku2.eventlog</pre></li> |
||
<li><p>Examine the activity graph. The dashed horizontal lines provide hints About the amount of activity you might expect. Here for example we are using two cores, which is reflected the line dividing the graph into two pieces.</p> |
<li><p>Examine the activity graph. The dashed horizontal lines provide hints About the amount of activity you might expect. Here for example we are using two cores, which is reflected the line dividing the graph into two pieces.</p> |
||
| − | [[Image:ThreadScope-sudoku2-activity.png| |
+ | [[Image:ThreadScope-sudoku2-activity.png|Threadscope activity]] |
<p>In the example above, we can see both cores nearly maxed out until around 1.85s at which point the amount of activity drops down to half.</p></li> |
<p>In the example above, we can see both cores nearly maxed out until around 1.85s at which point the amount of activity drops down to half.</p></li> |
||
<li><p>To see how this activity is distributed between cores, have a look at the HECs just below.</p> |
<li><p>To see how this activity is distributed between cores, have a look at the HECs just below.</p> |
||
| − | [[Image:ThreadScope-sudoku2-hec.png| |
+ | [[Image:ThreadScope-sudoku2-hec.png|One of the cores stopped working]] |
<p>It so happens that the reason the activity dropped in half is that one of the cores stopped working.</p></li> |
<p>It so happens that the reason the activity dropped in half is that one of the cores stopped working.</p></li> |
||
<li><p>Observe the link between activity and garbage collection.</p> |
<li><p>Observe the link between activity and garbage collection.</p> |
||
| − | [[Image:ThreadScope-sudoku2-gc.png| |
+ | [[Image:ThreadScope-sudoku2-gc.png|Activity ceased during garbage collection]] |
</li></ol> |
</li></ol> |
||
Revision as of 15:58, 7 December 2011
Objectives
Examine a ThreadScope profile on a realistic program

Concepts
- HEC - Haskell Execution Context; basically there is one HEC for each core you enable with the RTS option -N
Steps
Build sudoku2 and view its eventlog in ThreadScope
rm sudoku2
ghc -O2 sudoku2.hs -threaded -rtsopts -eventlog
./sudoku2 sudoku17.1000.txt +RTS -N2 -ls
threadscope sudoku2.eventlog
Examine the activity graph. The dashed horizontal lines provide hints About the amount of activity you might expect. Here for example we are using two cores, which is reflected the line dividing the graph into two pieces.

In the example above, we can see both cores nearly maxed out until around 1.85s at which point the amount of activity drops down to half.
To see how this activity is distributed between cores, have a look at the HECs just below.
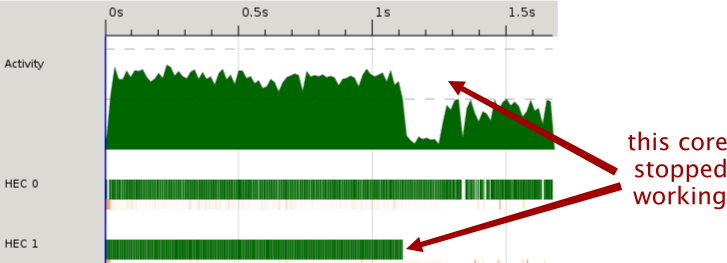
It so happens that the reason the activity dropped in half is that one of the cores stopped working.
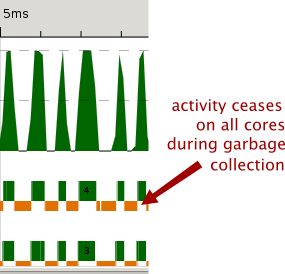
Observe the link between activity and garbage collection.


Questions and exercises
- What do you think is causing the uneven division between the 2 cores?
- If you have more than 2 course available, what happened when you enable them?
- Try profiling the k-means example and studying the profile.