ThreadScope Tour/Spark
Sparking too fast
Objectives
Use spark events to diagnose unthrottled sparking.
Note: you will need GHC 7.4 or higher to generate eventlogs used by the spark events viewer. You can use our sample logs if you just want to play with the UI a bit.
Steps
Download and build the parlist examples
 cd ThreadScope-Tour-examples
 make
Note the need for GHC 7.4
Run the parlist0 example, enabling collection of full spark events:
 ./parlist0 +RTS -N2 -lf
 threadscope parlist0.eventlog
Notice here that we pass the
fflag to the-l. This means that in addition to the events collected by default [(s)cheduler, (g)arbage collector, and s(p)ark events], we also want to collect the (f)ull details for par spark events. See the list of event flags for details.-lf not recognised? Your GHC is not recent enough
Have a look at the activity profile. What problems do you see?
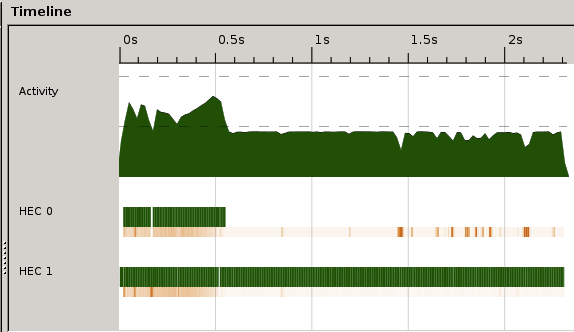
Some issues you may notice
- We are only get half the activity possible from our CPUs
- Most of work by HEC 1 after a while
- There is also some 'stutter' and interruption for garbage collection (orange)
We know now what some problems are, eg. only one CPU doing any work. Now how do we figure out what we have these problems?
Enable the spark creation and conversion traces
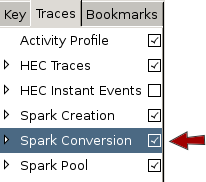
Scroll down to view these traces (shrink the bottom drawer if you need more room). What do you see?
HINT: Remember that the spark creation/conversion graphs represent rates (sparks per ms) and not quantity
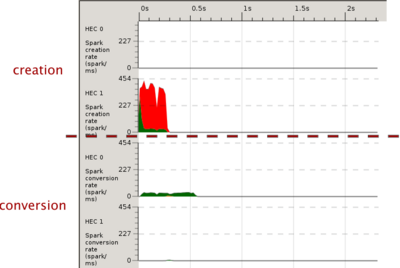
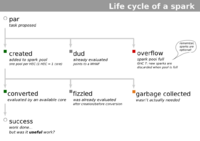
The creation charts show that a large proportion of attempted sparks overflow. They are not created because of spark pools are full. (It may be useful to have a look at the spark lifecycle if you have not done so already).
Scrolling down a bit further to the spark pool. Notice how the spark pool usage for HEC 1 shoots up until full and gradually declines as the pool is depleted.
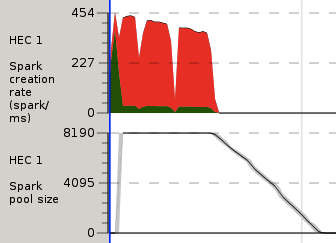
Compare this with the spark creation chart. The red bits (overflow) coincide with the spark pool being full (TODO this isn't quite true; have I misunderstood something?)
We can see that we're getting overflow, that we are generating many sparks way faster than we can convert them, or conversely that we aren't converting sparks fast enough.
Have a look at the source code. Do you see anything that suggests excessive sparking?
main =
  let xs = [ fib (5 + n `mod` 10) | n <- [0..100000] ]
             `using` parListWHNF
   in print (sum xs)

-- HINT: look here!
parListWHNF :: Strategy [a]
parListWHNF xs = go xs `pseq` return xs
  where
    go []     = []
    go (y:ys) = y `par` go ys
Study the parListWHNF function; it sparks the entire list off in parallel, all 100 thousand fibonnaci computations. Maybe we need to generate sparks a little less aggressively.
- Move on to the next section to see what happens when we throttle spark creation with the rolling buffer trick.


Hints and Tips
- Not enough vertical space? Try shrinking the bottom drawer or just disable 'Views > Information Pane'
- Remember that the spark creation/conversion graphs represent rates (sparks per ms) and not quantity