ThreadScope Tour/SparkOverview
Jump to navigation
Jump to search
The printable version is no longer supported and may have rendering errors. Please update your browser bookmarks and please use the default browser print function instead.
ThreadScope and sparks
ThreadScope 0.2.1 and higher come with spark event visualisations that help you to understand not just what behaviours your parallel program is exhibiting (eg. not using all cores) but why.
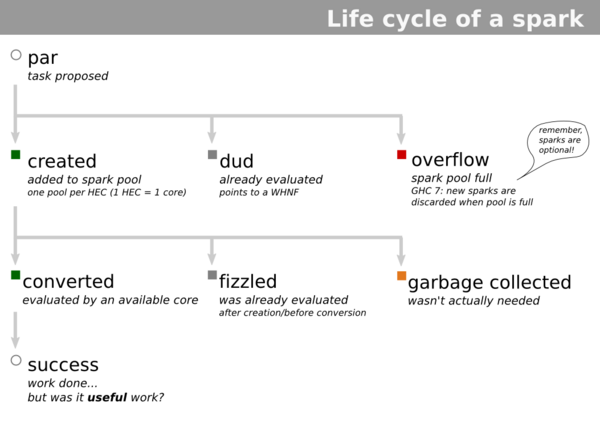
It helps to know a bit about sparks:
Spark viewer features
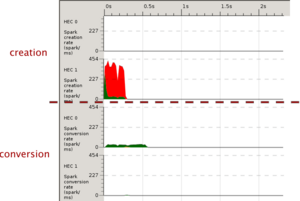
Review spark creation and creation rates:
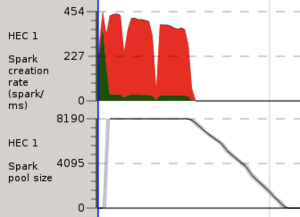
Track the size of the spark pool:
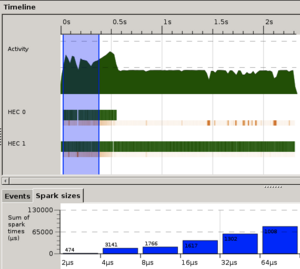
See the distribution of sparks grouped by their sizes:
Things to look for
The combination of features can be used to look for some common problems such as
- Too few sparks (not enough parallelism)
- spark pool hits empty
- low spark creation rate
- Too many sparks
- overflow (red) is wasted work
- can cause catastrophic loss of parallelism
- Too many duds or fizzled sparks (grey)
- Too many sparks get GC'd (orange)
- Sparks too small (overheads too high)
- Sparks too big (load balancing problems, eg. sudoku2)
In the following sections we will walk through some examples of attempts to diagnose these problems.


