ThreadScope Tour/Zoom
Jump to navigation
Jump to search
The printable version is no longer supported and may have rendering errors. Please update your browser bookmarks and please use the default browser print function instead.
Objectives
- Use zooming to reveal more detailed performance issues
- Save your place with the bookmark feature and zoom back out
Steps
Open the sudoku3 ThreadScope profile created earlier
threadscope ./sudoku3.eventlog
Notice the initial lack of activity at the very beginning of program execution
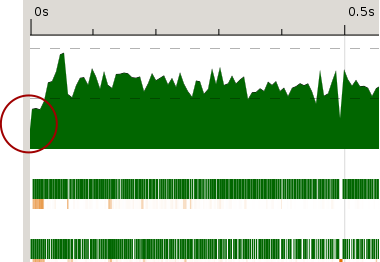
What's going on there?
Use the zoom in button to explore that space a bit more
Hint: you can also press +/- on the keyboard
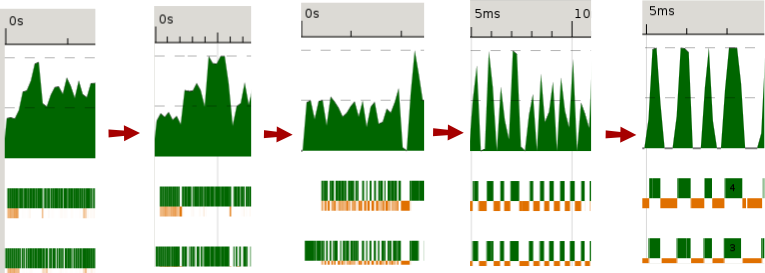
Notice how different the profile looks close up. What do you see? At closer inspection what looks like a moderate amount of activity is actually intense bursts using both cores, with pauses in between.
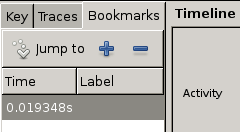
Save a point in the zoomed-in profile as a bookmark. To do so, click in the graph to move the blue cursor to a spot of your choice.

Then switch to bookmarks tab. Press the plus button to create the bookmark and click in the labels field to name it.

- TODO zoom out again, use bookmarks to help refocus


Hints
- You can also press +/- on the keyboard to zoom in and out