ThreadScope Tour/Profile2
Jump to navigation
Jump to search
Objectives
Use GHC statistics and ThreadScope to see how changes to code affect performance.
Steps
Build sudoku3, generating statistics and a ThreadScope profile
rm sudoku3
ghc -O2 sudoku3.hs -threaded -rtsopts -eventlog
./sudoku3 sudoku17.1000.txt +RTS -s -N2 -ls
Examine the statistics, again focusing on the sparks and timing block
SPARKS: 1000 (1000 converted, 0 pruned)

INIT  time    0.00s  (  0.01s elapsed)
MUT   time    3.61s  (  2.17s elapsed)
GC    time    0.62s  (  0.14s elapsed)
EXIT  time    0.00s  (  0.00s elapsed)
Total time    4.23s  (  2.31s elapsed)
Note the change in total time and notice also that we are now generating a lot more sparks than before (see Parallel and Concurrent Programming in Haskell for details on why)
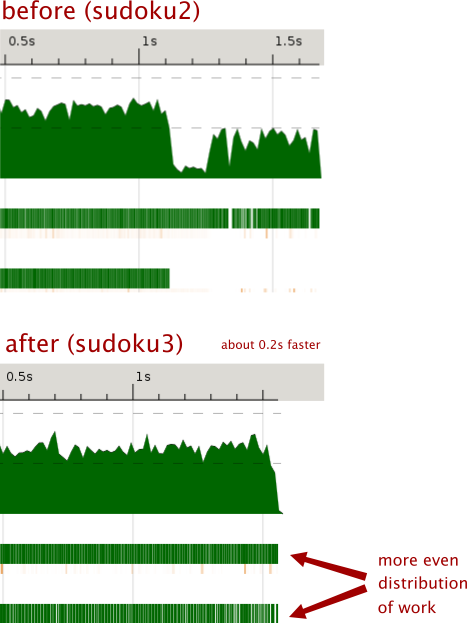
Now examine the ThreadScope profile for the improved sudoku
threadscope ./sudoku3.eventlog
At the same time, open the ThreadScope profile for the older sudoku and compare the two profiles. You may need to resize the windows or maybe just switch back and forth one window and another.

Notes and exercises
- Future versions of ThreadScope will allow you to directly compare event logs for two different runs of the same program
- If you have more than 2 cores available, what happened when you enable them?